Usage Overview
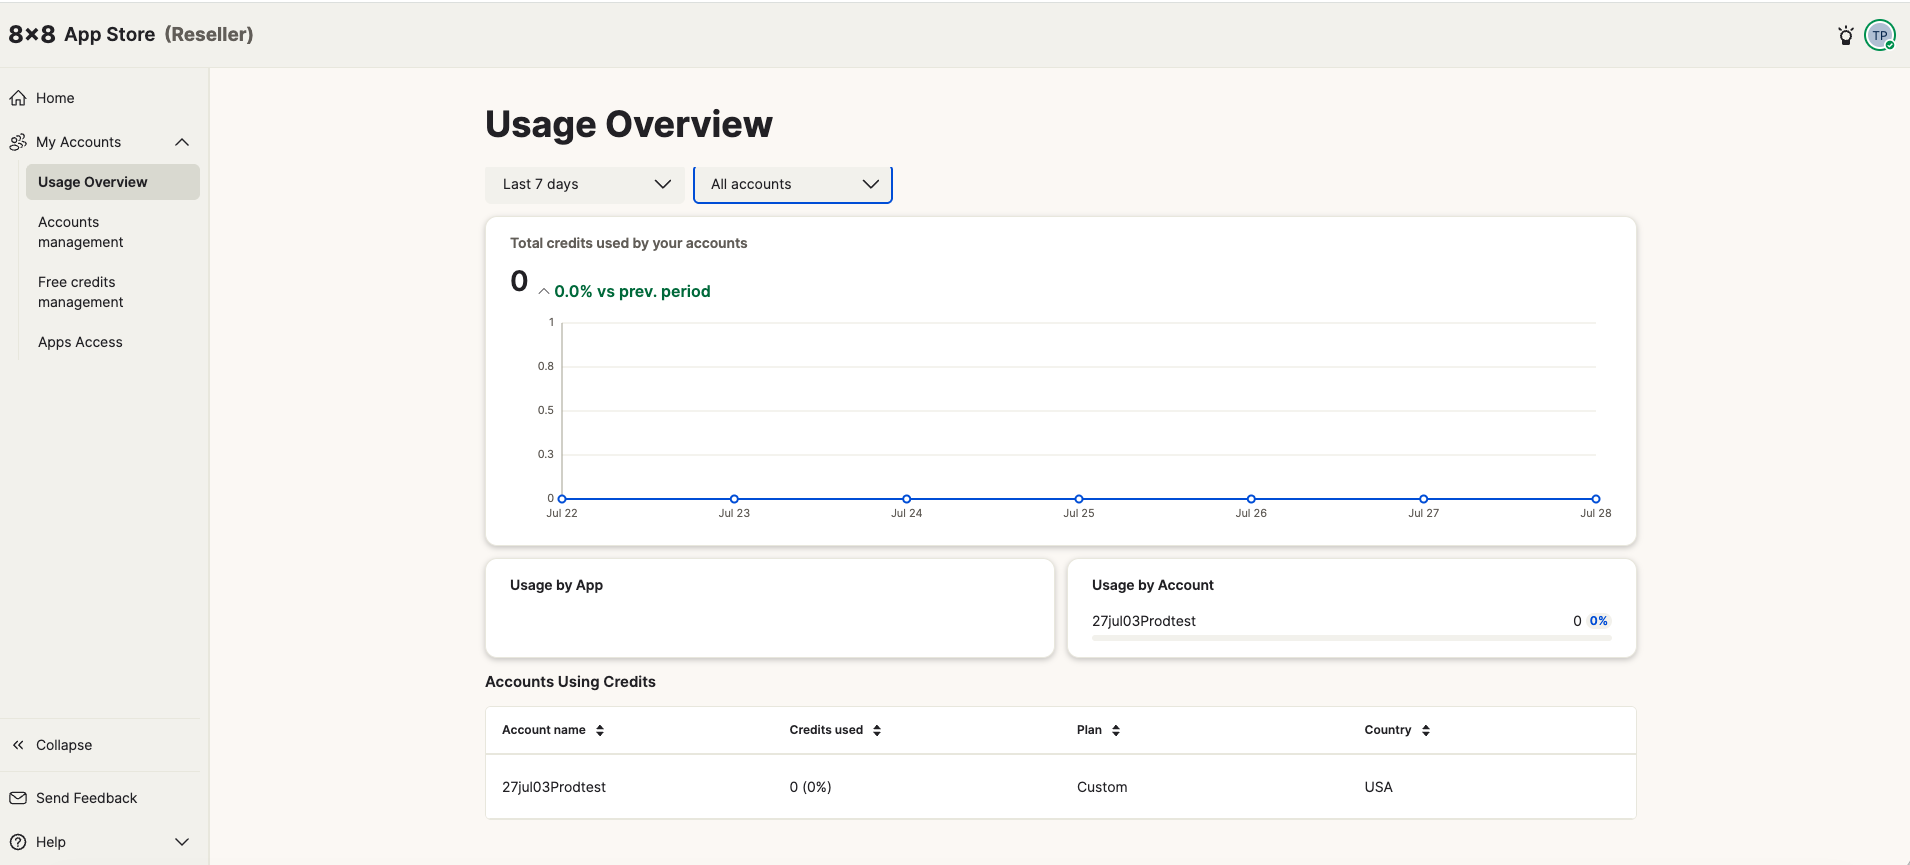
Usage Overview gives you a consolidated view of credit consumption across all your customer accounts. Use it to track which accounts and apps are driving usage, spot unusual spikes, and keep an eye on your billing exposure.
Navigate here via My Accounts → Usage Overview.
Filters
Two filters at the top of the page let you scope the data:
- Time period — defaults to Last 7 days; adjust to view longer windows
- Account — defaults to All accounts; select a specific account to drill into a single customer
Total credits used
The headline figure shows total credits consumed across the selected accounts and period, along with a percentage change versus the previous period of the same length. A line chart beneath plots usage day by day, making it easy to see trends and one-off spikes.
Usage by App and Usage by Account
Two summary panels sit side by side below the chart:
- Usage by App — shows credit consumption broken down by application, so you can see which apps your customers are using most
- Usage by Account — shows the total credits consumed per account, with a percentage of overall usage
These panels update in real time as you change the filters above.
Accounts Using Credits table
The bottom of the page lists every account that has consumed credits in the selected period, with columns for:
- Account name
- Credits used (and percentage of total)
- Plan
- Country
Sorting by Credits used helps you quickly identify your highest-consuming accounts.
Tip: If you have distributed free credits to an account, monitor their usage here. Once free credits are exhausted, any further paid app usage on that account will generate billable charges at the rate specified in your commercial agreement with 8x8.